← All demonstrations

Machine Learning / Evaluated demonstration

Drift Signal

Separate changing inputs from declining model performance.

WHO IT HELPS
Industrial teams and predictive-model owners.
WHAT IT DOES
Separate changing inputs from declining model performance.
DEMO OUTPUT
Prediction bands, separate alerts, affected variables and JSON export.
Scope a Machine Learning pilot →

Actual recording · Explanatory English captions · Original synthetic data

Recorded demonstration of a functional local application. A pilot defines data, access and deployment; this website serves the video and screenshots.

THE PROBLEM

A model can keep answering after the process it learned has changed.

THE WORKFLOW

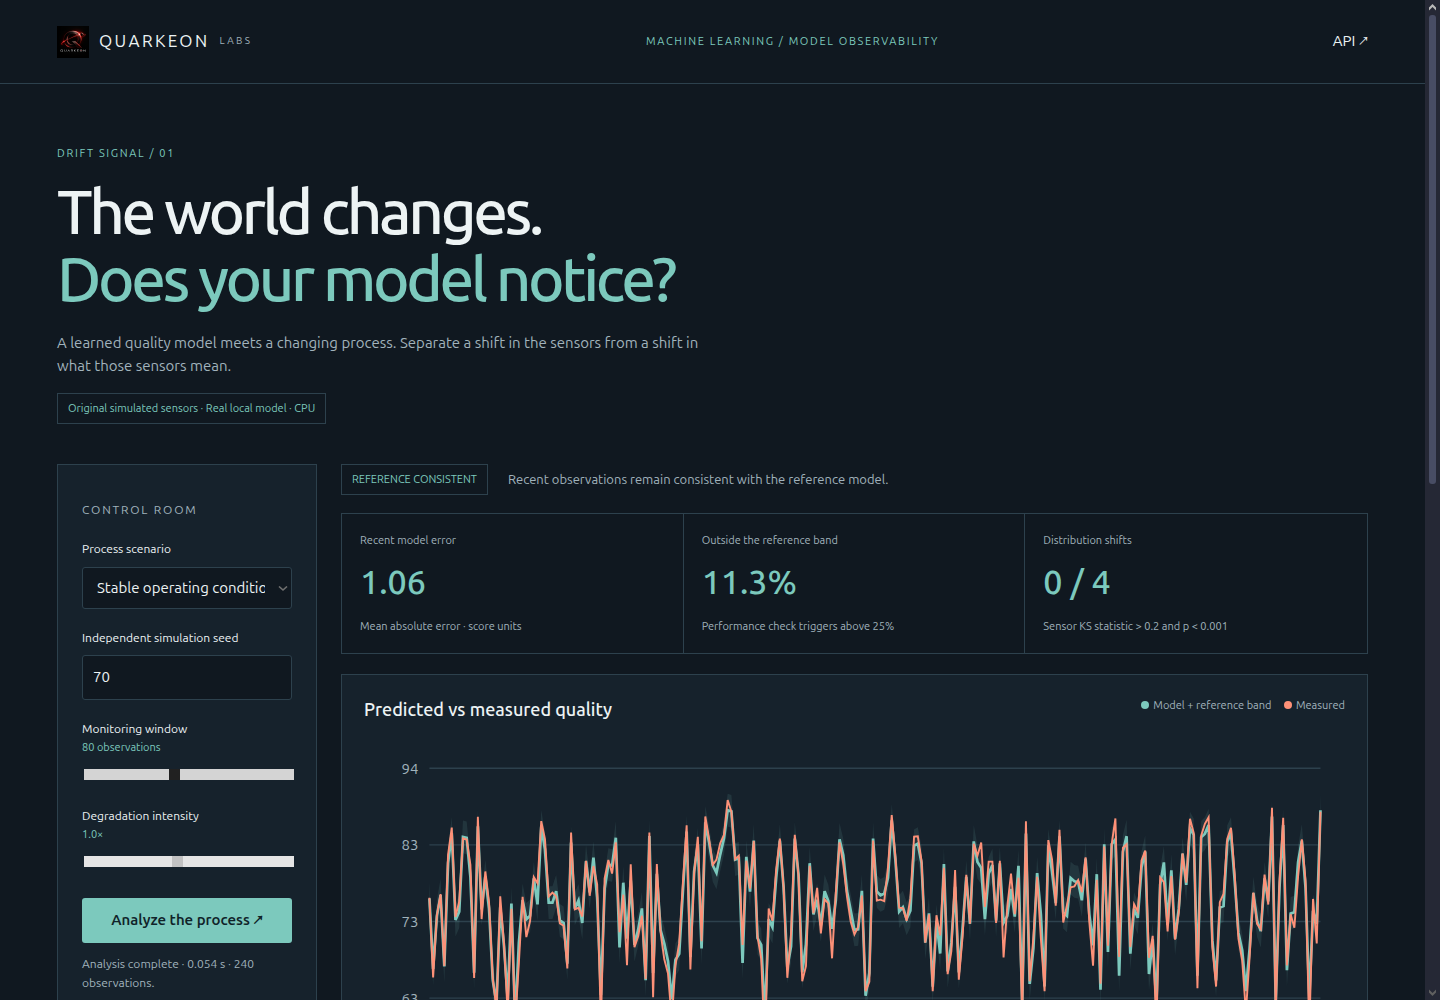
An Extra Trees regressor learns from simulated sensors, with split conformal prediction bands. Switch between a stable process, shifted inputs and changed quality. The dashboard checks feature distributions and observed outcomes separately. A CSV following the demo schema can also be analysed.

  1. 01Choose a scenario or import a compatible CSV.
  2. 02Compare predictions, observations and calibrated bands.
  3. 03Review input and performance alerts separately.
  4. 04Export the analysis to review changes.

RECORDED EVIDENCE

Results, with context.

Checks on heldout synthetic examples
CheckCases
Documented checks; synthetic data30 of 30
Dataset
synthetic-sensors-v1
Completed cases
30/30
Median / p95 per case
0.014881679997415631 s / 0.025337445548757387 s
Evaluation record (UTC)
2026-10-10

30 heldout scenarios: ten separate seeds, three controlled conditions per seed. All 30 classifications match expectations. Prediction metrics use another heldout set; they do not establish industrial accuracy. Timings measure the analysis function on CPU with the model ready, excluding HTTP and training.

WHAT WE COULD BUILD WITH YOU

A model monitor connected to your metrics and review workflow.

What we would define first

Existing model, features, availability of real outcomes, analysis window and acceptable thresholds.

Demonstration limits

Fictional process; it does not diagnose causes or guarantee interval coverage under drift. On 300 heldout rows, MAE was 1.10 and band coverage was 88.3%. Performance alerts require observed outcomes.

Scope a Machine Learning pilot ↗
Screenshot of the interface for Drift Signal
Demonstration review interface.

Explore other projects