← All demonstrations

Machine Learning / Evaluated demonstration

Spectral Atlas

Separate spectral components and highlight signals the model cannot explain.

WHO IT HELPS
Scientific, spectroscopy and materials-research teams.
WHAT IT DOES
Separate spectral components and highlight signals the model cannot explain.
DEMO OUTPUT
Learned components, reconstruction, relative contributions and novelty flag.
Scope a Machine Learning pilot →

Actual recording · Explanatory English captions · Original synthetic data

Recorded demonstration of a functional local application. A pilot defines data, access and deployment; this website serves the video and screenshots.

THE PROBLEM

A mixed curve can hide components and unexpected peaks.

THE WORKFLOW

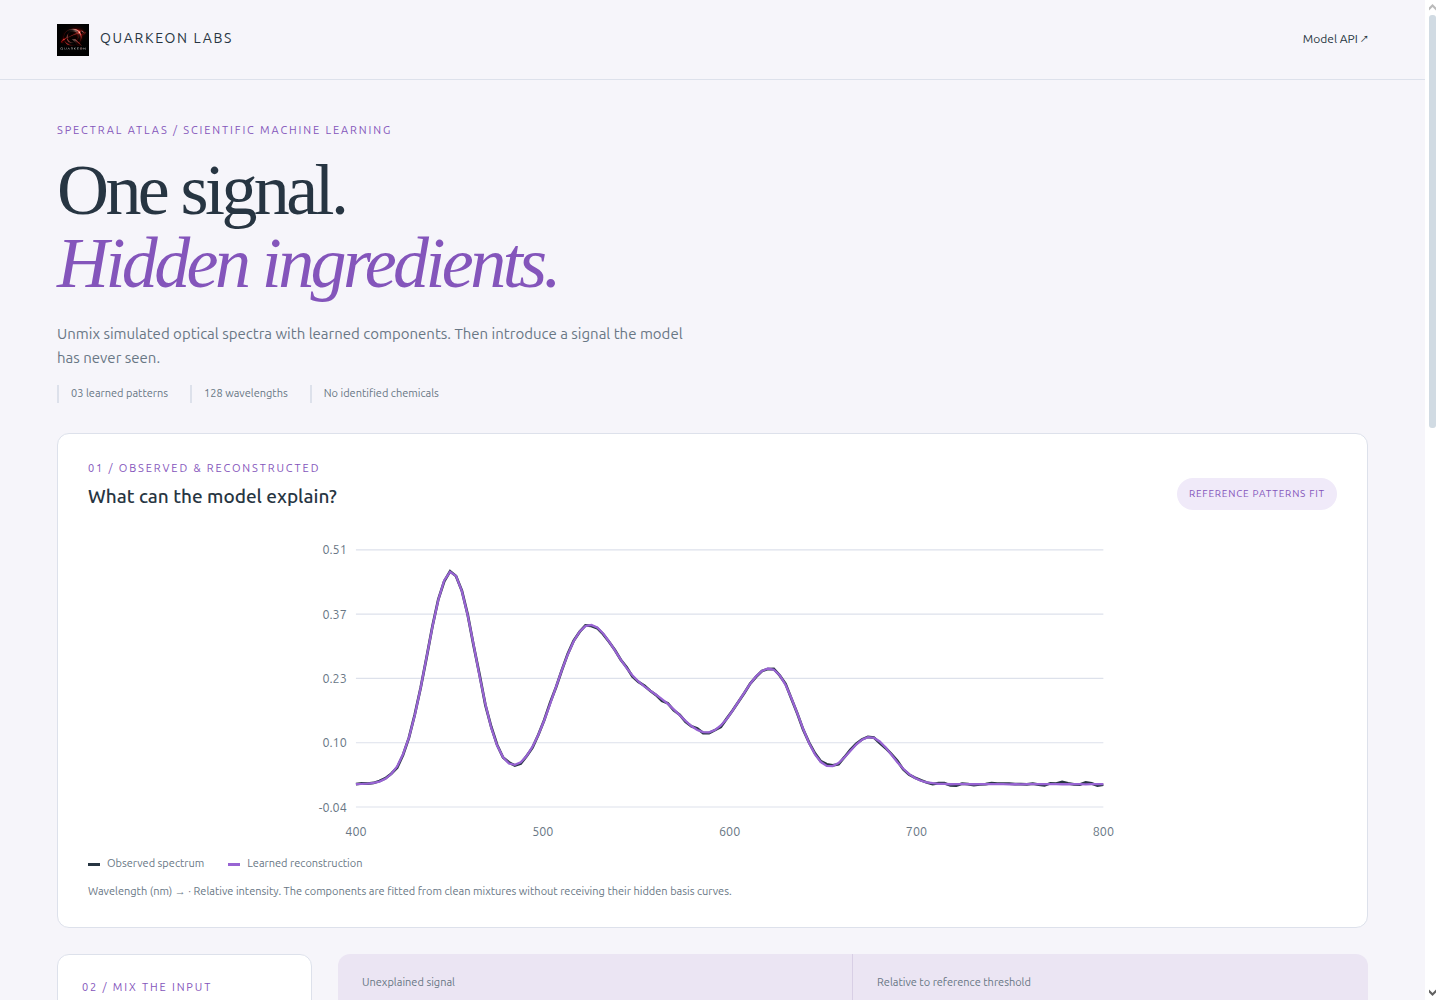
NMF learns three components from 240 synthetic training spectra. Change mixture proportions, noise and an unfamiliar peak; compare the observed spectrum with its reconstruction and inspect the residual. A compatible wavelength/intensity CSV can also be imported.

  1. 01Load a spectrum or adjust a synthetic mixture.
  2. 02Inspect learned components and reconstruction.
  3. 03Add an unfamiliar peak and examine the residual.
  4. 04Export the result and review limitations.

RECORDED EVIDENCE

Results, with context.

Checks on heldout synthetic examples
CheckCases
Documented checks; synthetic data99 of 100
Dataset
synthetic-optical-mixtures-v1
Completed cases
100/100
Median / p95 per case
0.0003569839991541812 s / 0.0003967136022765771 s
Evaluation record (UTC)
2026-10-10

100 heldout examples: 60 known mixtures and 40 with a controlled new peak. 99 decisions match expectations, retaining and reporting the false positive. Alignment with simulator components is computed only after training. Timings measure the analysis function on CPU, excluding HTTP and training.

WHAT WE COULD BUILD WITH YOU

A spectral exploration tool with references and review criteria.

What we would define first

Instrument, wavelength range, preprocessing, reference data and independent validation.

Demonstration limits

Synthetic spectra from 400 to 800 nm. Contributions are relative to the model, not chemical concentrations or substance identification. One false positive occurred among 60 normal mixtures; all 40 with the test peak were flagged.

Scope a Machine Learning pilot ↗
Screenshot of the interface for Spectral Atlas
Demonstration review interface.

Explore other projects