 Evaluated demo
Stock Atlas
From image to inventory. Unit by unit.
1/1Scene with correct count (9 units)Recorded synthetic dataset
Vision / Evaluated demonstration
Small defects. Visible evidence.
Real demo recording · English narration and captions · Fictional data
THE PROBLEM
THE WORKFLOW
Compare synthetic panels against a normal-surface memory bank. A local ResNet18 produces anomaly distances; the reviewer inspects the heat map, records a decision and exports the evidence.
RECORDED EVIDENCE
| Check | Cases |
|---|---|
| Test panels: correct classification | 16/16 |
| Interface examples: correct classification | 4/4 |
Source: the project’s evaluation record, using local inference. Recorded hardware: NVIDIA GeForce RTX 4070 Laptop GPU / 8 GB. Latency includes the full HTTP case and may include initial model loading. These measurements have not been rerun on the machine serving this website.
WHAT WE COULD BUILD WITH YOU
Part types, tolerances, normal references, capture conditions and the cost of false positives and negatives.
Sixteen test panels use seeds separate from the references, but the same synthetic generator. This does not measure industrial accuracy. The heat map is not certified defect segmentation.
Discuss your use case ↗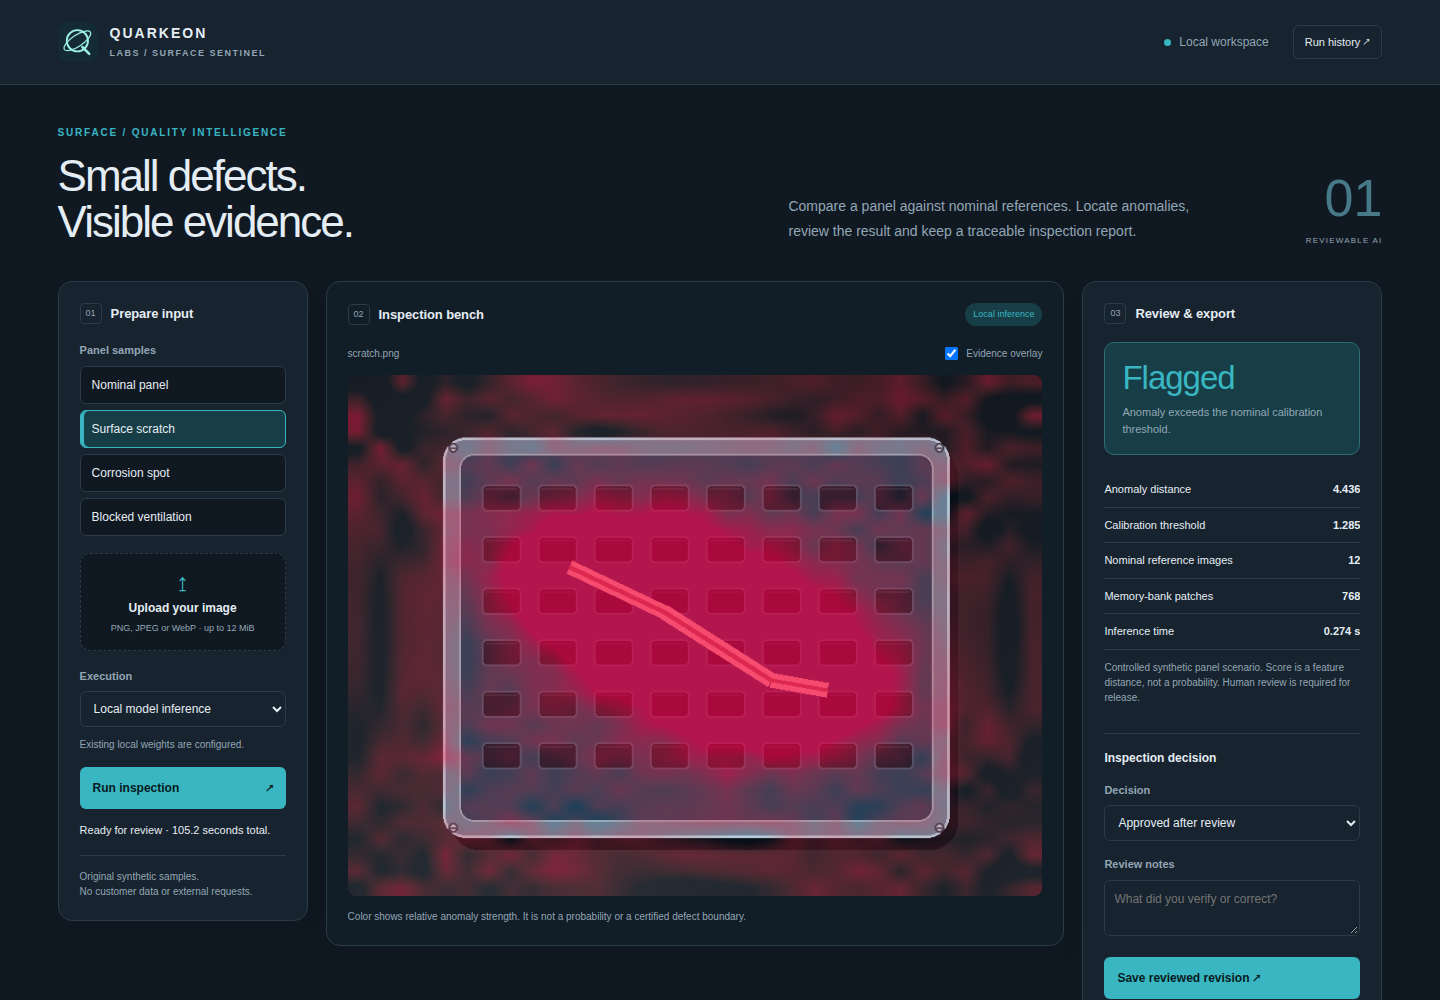 Evaluated demo
From image to inventory. Unit by unit.
 Evaluated demo
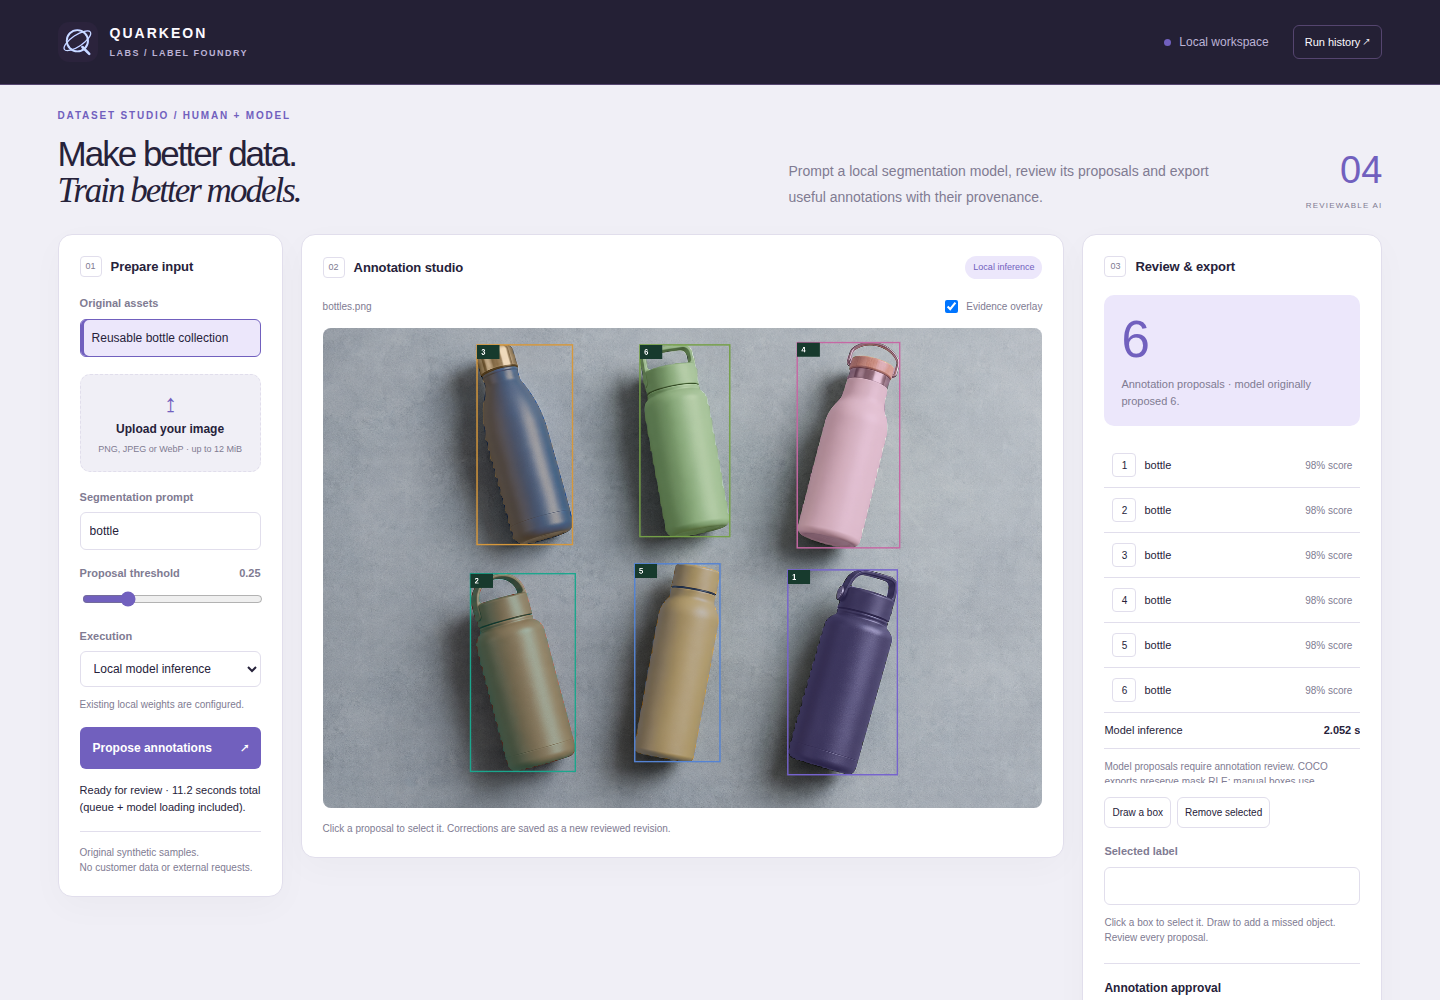
From a prompt to a dataset you can review.